Data Analytics & Reporting

Business Intelligence Infrastructure

Data analytics and reporting systems serve as information engines that convert raw data into actionable insights. Organizations collect vast amounts of information from operations, customer interactions, financial transactions, and market activities. Analytics platforms process this information to reveal patterns, trends, and opportunities that drive business strategy.
Infrastructure requirements include data storage systems, processing engines, and visualization tools. Cloud platforms provide scalable computing resources that expand with growing data volumes. On-premises solutions offer direct control over security and performance characteristics.

Data Collection & Preparation

Data collection begins with identifying relevant information sources across the organization. Transactional systems, log files, customer databases, and external feeds contribute to analytical datasets. APIs and connectors enable automated extraction from various platforms and applications.
Data preparation involves cleaning, standardization, and enrichment processes. Missing values require handling through imputation or exclusion strategies. Duplicate records must be identified and resolved. Data types need conversion to support analytical processing requirements.
Quality assurance procedures validate accuracy and completeness of source data. Automated checks identify anomalies and inconsistencies that require investigation. Data profiling reveals distribution patterns and relationship structures within datasets.

Analytical Methods & Techniques

Descriptive analytics summarize historical performance through statistical measures and trend analysis. This foundational layer provides context for understanding business operations and customer behavior patterns. Metrics include averages, totals, growth rates, and comparative ratios.
Diagnostic analytics investigate root causes behind observed patterns. Correlation analysis identifies relationships between variables. Segmentation techniques group customers or products based on shared characteristics. Time series analysis reveals seasonal patterns and cyclical trends.
Predictive analytics forecast future outcomes using machine learning algorithms. Regression models estimate continuous values such as sales revenue or customer lifetime value. Classification algorithms predict categorical outcomes like customer churn or product preferences.
Prescriptive analytics recommend specific actions to optimize business outcomes. Optimization engines evaluate multiple scenarios to identify best courses of action. Simulation models test potential strategies before implementation.

Reporting Architecture & Design

Reporting architecture balances performance requirements with user accessibility needs. Data warehouses store processed information in structures optimized for query performance. OLAP cubes enable multidimensional analysis across time periods and organizational hierarchies.
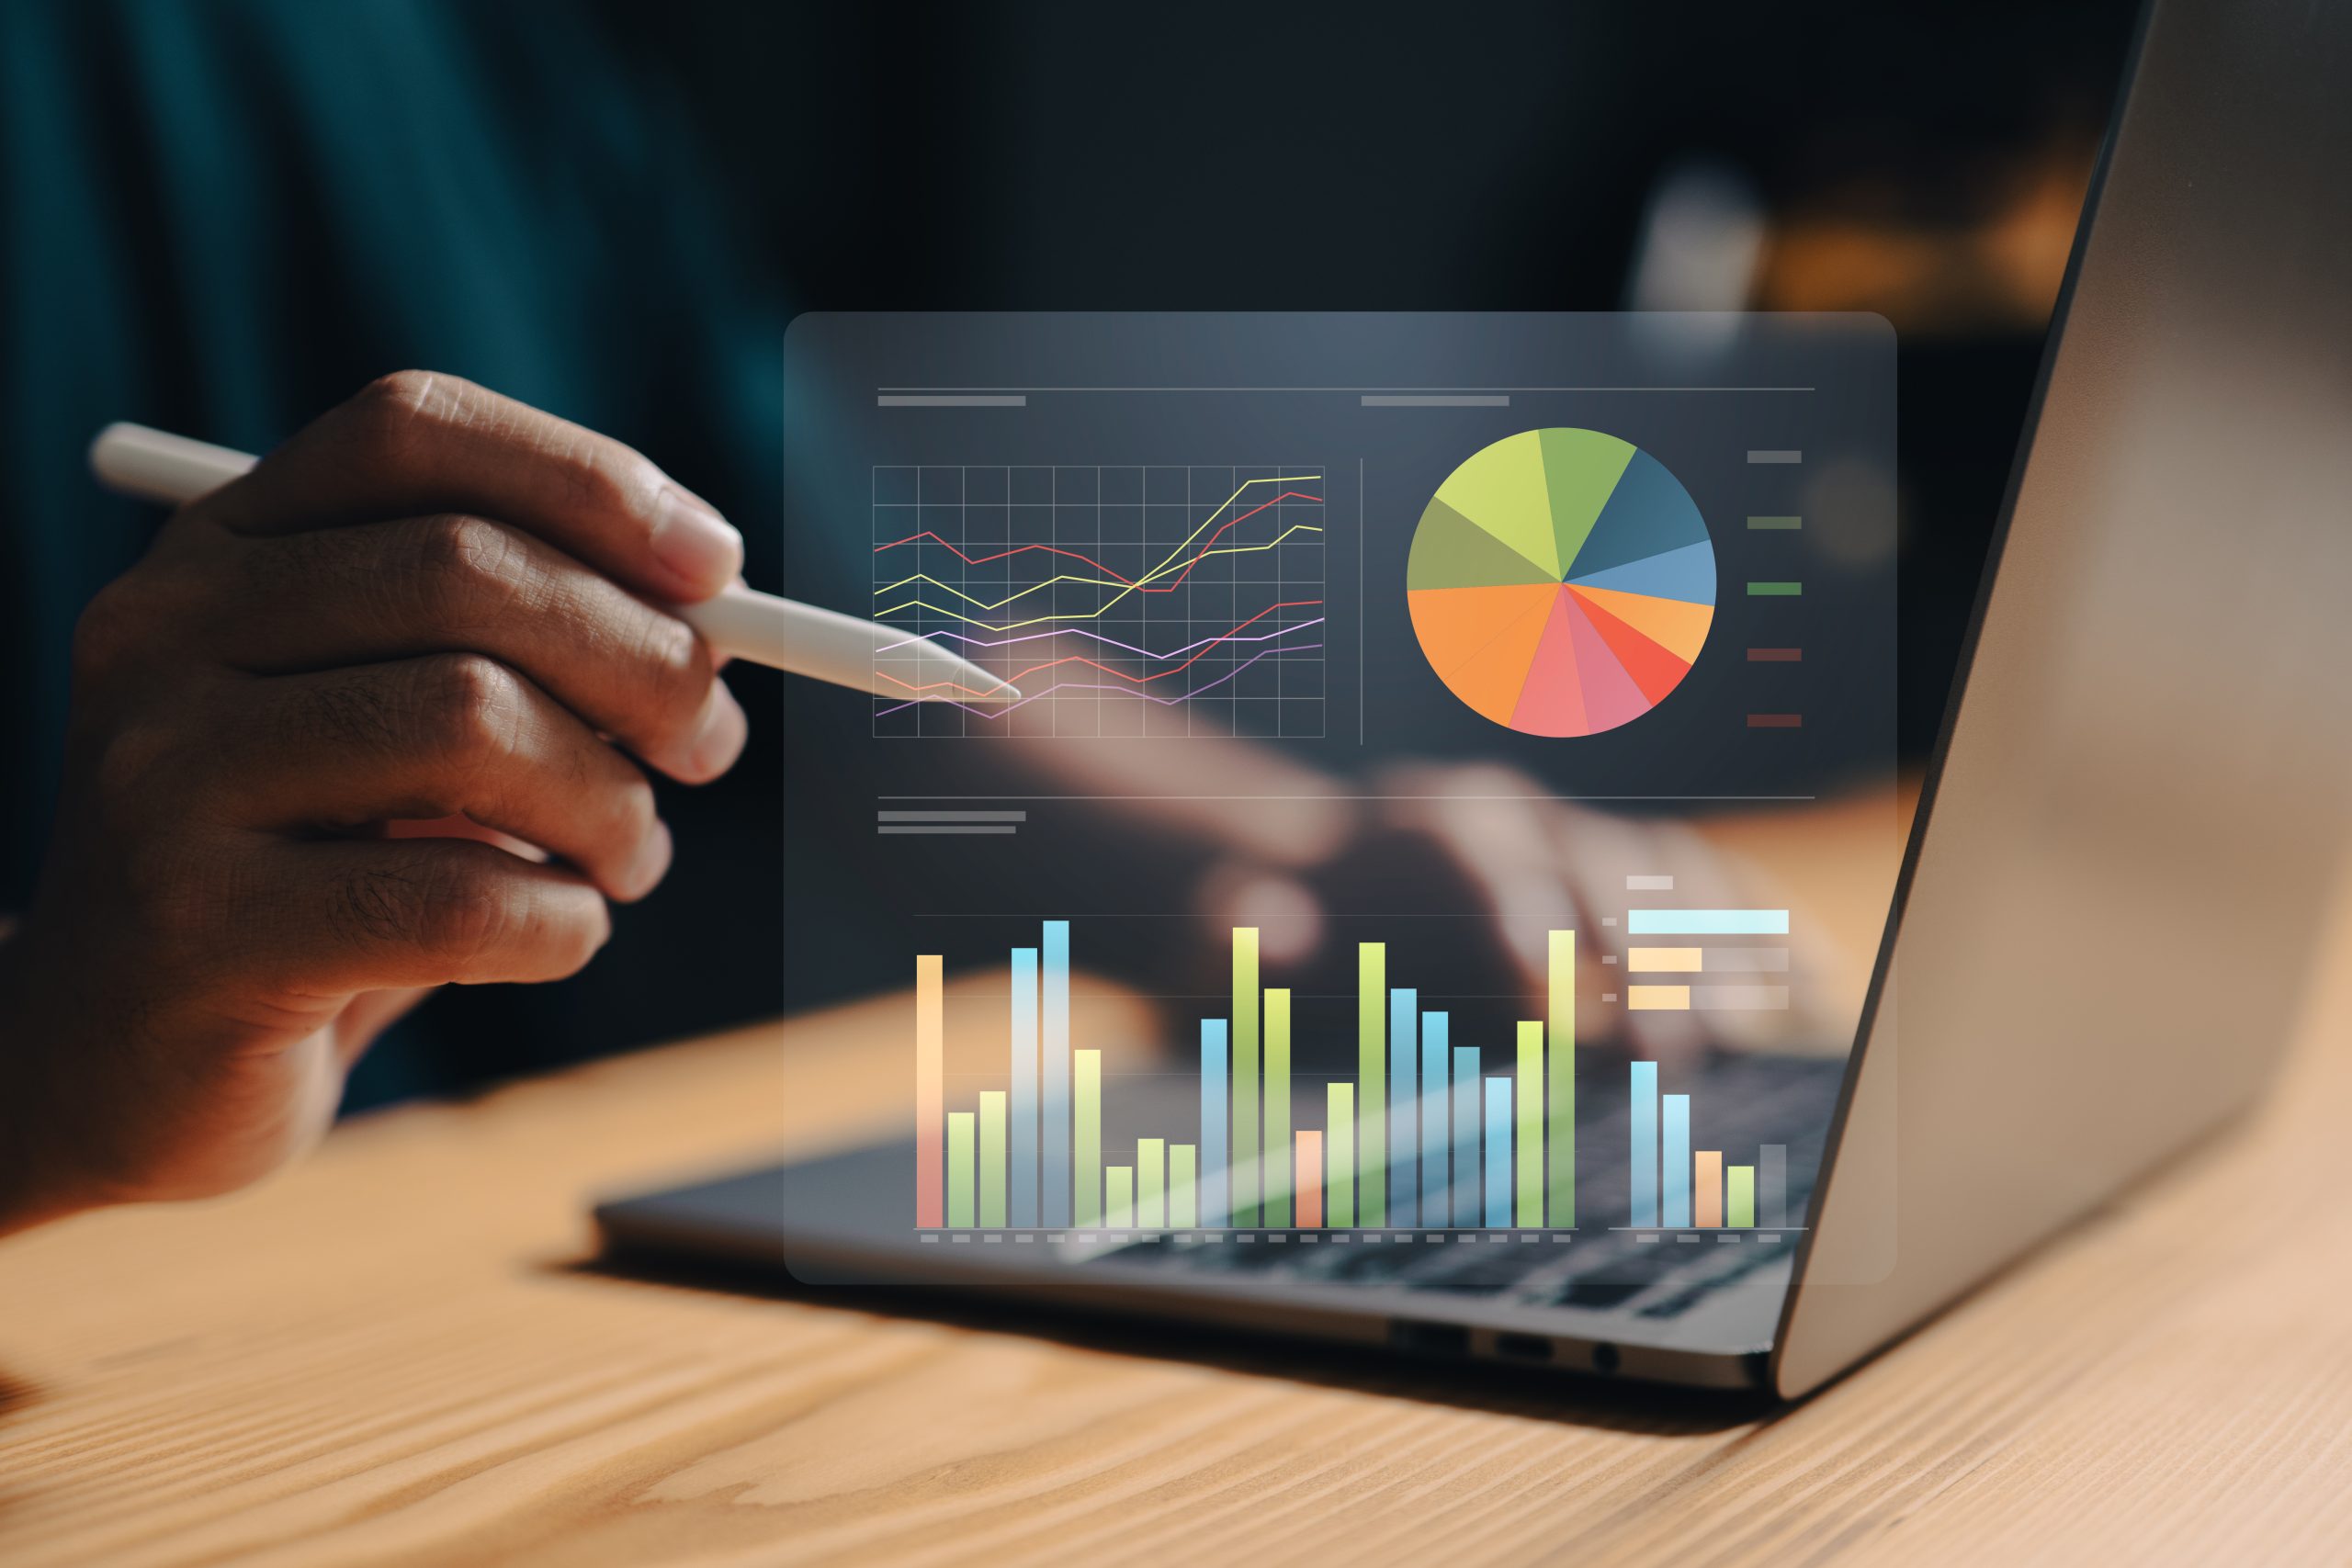
Report design principles focus on clarity and actionability. Charts and graphs communicate trends more effectively than tables of numbers. Color coding highlights exceptions and key performance indicators. Drill-down capabilities allow users to explore underlying details.

Dashboard Development & Visualization

Dashboard development begins with understanding user information needs and decision-making processes. Executive dashboards emphasize high-level KPIs and exception reporting. Operational dashboards provide real-time status updates and performance metrics.
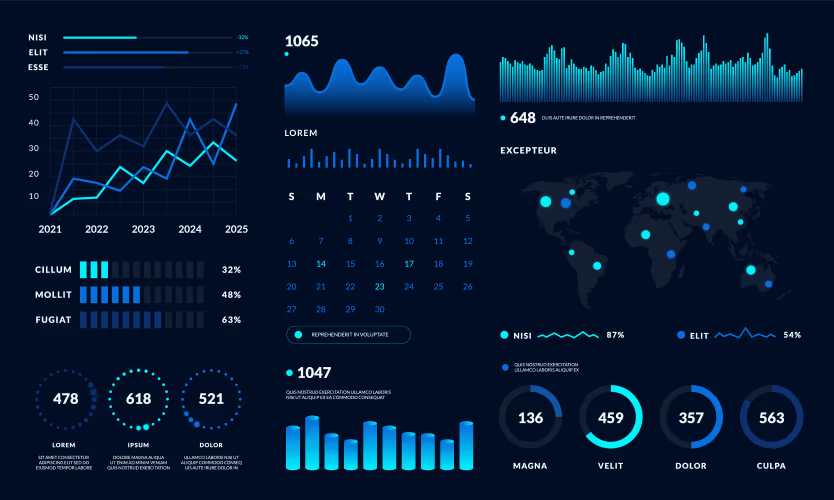
Visualization selection depends on data types and analytical objectives. Line charts show trends over time. Bar charts compare values across categories. Heat maps reveal patterns in multidimensional data. Geographic maps display location-based information.
Interactive features enable users to filter data and adjust parameters. Drop-down menus provide selection options. Date range controls modify time periods for analysis. Parameter controls support what-if scenario evaluation.

Real-Time Analytics & Streaming Data

Real-time analytics process information as events occur, enabling immediate response to changing conditions. Streaming data platforms handle continuous flows of information from sensors, applications, and user interactions. Processing engines apply business rules and analytical models to incoming data streams.
Event detection algorithms identify significant occurrences that require attention. Threshold monitoring triggers alerts when metrics exceed predefined limits. Anomaly detection highlights unusual patterns that may indicate problems or opportunities.

Self-Service Analytics Capabilities

Self-service analytics empower business users to create reports and perform analysis without technical assistance. Drag-and-drop interfaces simplify data exploration and visualization creation. Pre-built templates accelerate common analytical tasks.
Data discovery tools help users locate relevant information within organizational datasets. Search capabilities enable finding specific metrics or dimensions. Data lineage documentation explains source and calculation methods for transparency.
Training programs develop analytical skills among business users. Video tutorials demonstrate tool usage and best practices. Documentation provides reference materials for common tasks and troubleshooting.

Performance & Scalability Management

Performance optimization ensures responsive user experiences as data volumes grow. Indexing strategies accelerate query execution times. Caching mechanisms store frequently accessed results for quick retrieval. Partitioning distributes large datasets across multiple storage devices.
Capacity planning anticipates resource requirements for growing user populations and data volumes. Load testing validates system performance under expected usage patterns. Monitoring tools track response times and resource utilization.

Data Governance & Security

Data governance frameworks establish policies for information access, usage, and quality standards. Data stewards maintain accuracy and consistency within their functional domains. Classification schemes identify sensitivity levels and access requirements.
Security measures protect information from unauthorized access and ensure compliance with privacy regulations. Role-based access controls limit data visibility to appropriate users. Encryption protects data during transmission and storage.
Audit trails track user activities and data modifications for compliance reporting. Automated logging captures system events and user interactions. Retention policies manage historical data storage and deletion schedules.

Mobile & Cloud Analytics

Mobile analytics extend reporting capabilities to smartphones and tablets. Responsive design adapts dashboards to different screen sizes. Touch interfaces enable intuitive navigation and interaction. Offline capabilities support access when network connectivity is limited.
Cloud analytics platforms provide scalable infrastructure without capital investments. Pay-as-you-go pricing models align costs with actual usage. Global availability ensures consistent performance across geographic locations.

Advanced Analytics Integration

Integration with advanced analytics platforms expands capabilities beyond traditional reporting. Machine learning models predict customer behavior and market trends. Natural language processing analyzes text data from customer feedback and social media.
API connections enable embedding analytical results into operational applications. Automated decision-making systems apply model outputs to business processes. Integration platforms coordinate data flows between analytical and operational systems.
Organizations implementing analytics and reporting solutions gain improved visibility into business performance, faster decision-making capabilities, and competitive advantages through data-driven insights.

Candidate Submission Form

Job Posting Template